In some cases, the single oscilloscope trace shows two different waveforms overlayed. This is due to the operation of the voltage regulator on the motorcycle, the waveforms do actually change. Some cycles will be shunted and some won't. The oscilloscope shows the shunted and the non-shunted cycles seemingly at the same time. Obviously, they do not occur at the same time, the persistence of the phosphor screen causes that illusion.
The oscilloscope is set to 5v per division vertical. The time scale is different depending on the RPM. It was adjusted to show one or two cycles.
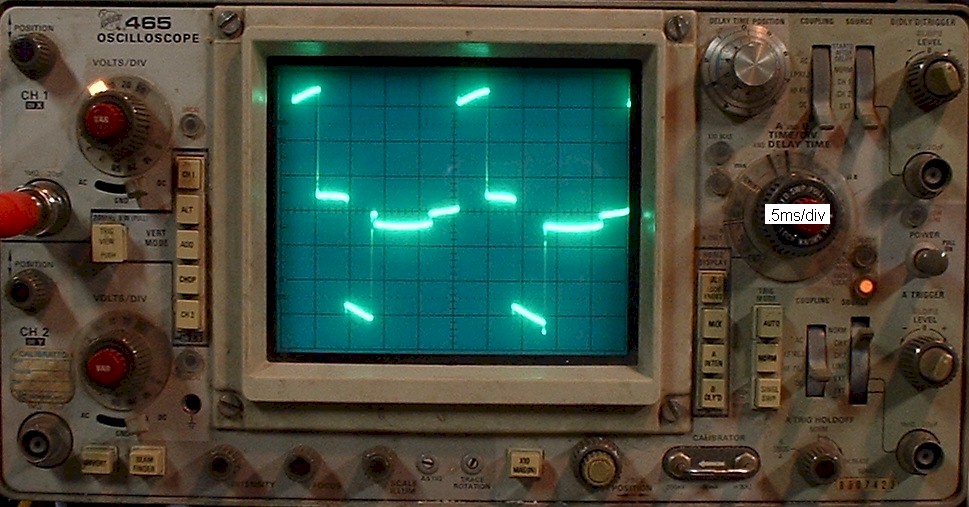
 Waveform between two alternator wires (2 yellow wires).
1100 RPM, Lights on.
Waveform measured AC voltage: 11.3 Vac
Battery Voltage: 12.65 Vdc
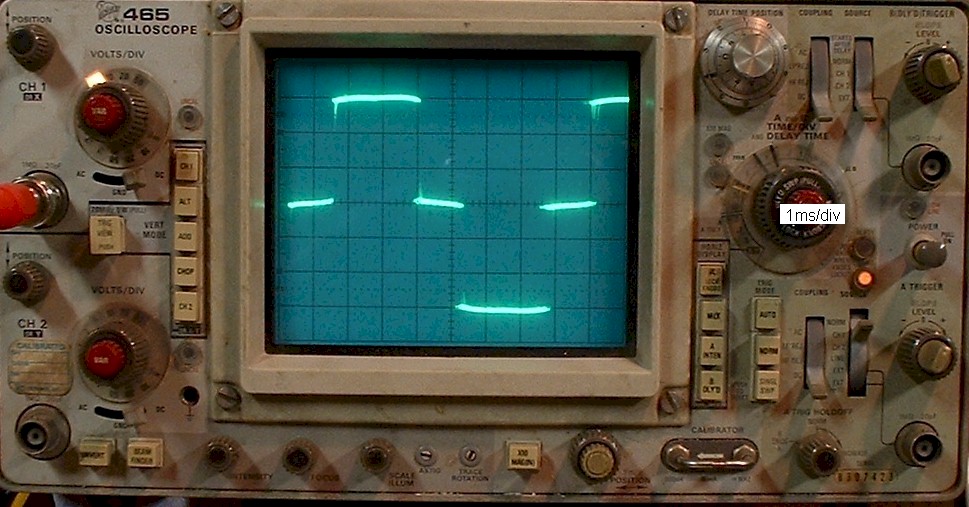
Because the battery voltage is low, no shunting occurs. Each trace is almost exactly the same as the previous one. The pulses are almost evenly spaced. Had this been a single-phase alternator, the gaps between positive and negative pulses would have been almost non-existant.
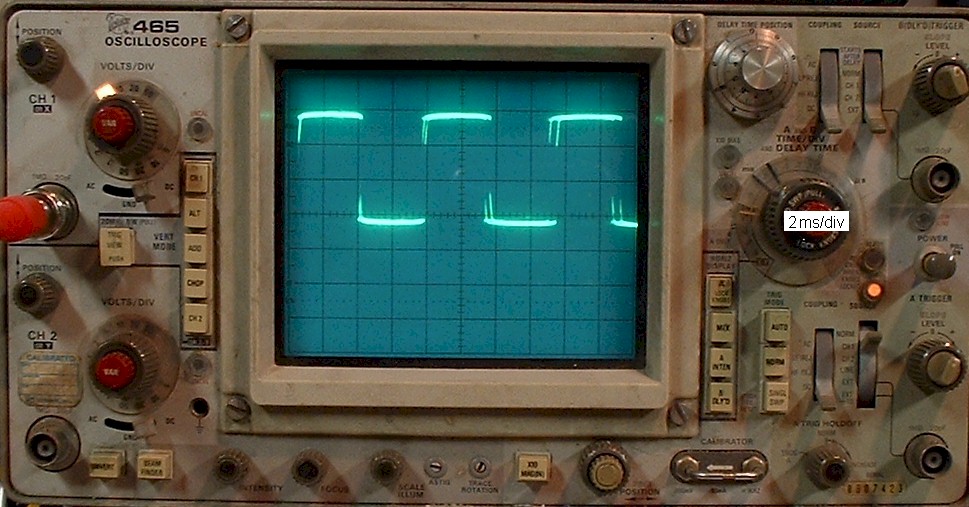
Fig. 2
Waveform between two alternator wires (2 yellow wires).
1100 RPM, Lights off.
Waveform measured AC voltage: 9.0 Vac
Battery Voltage: 14.35 Vdc
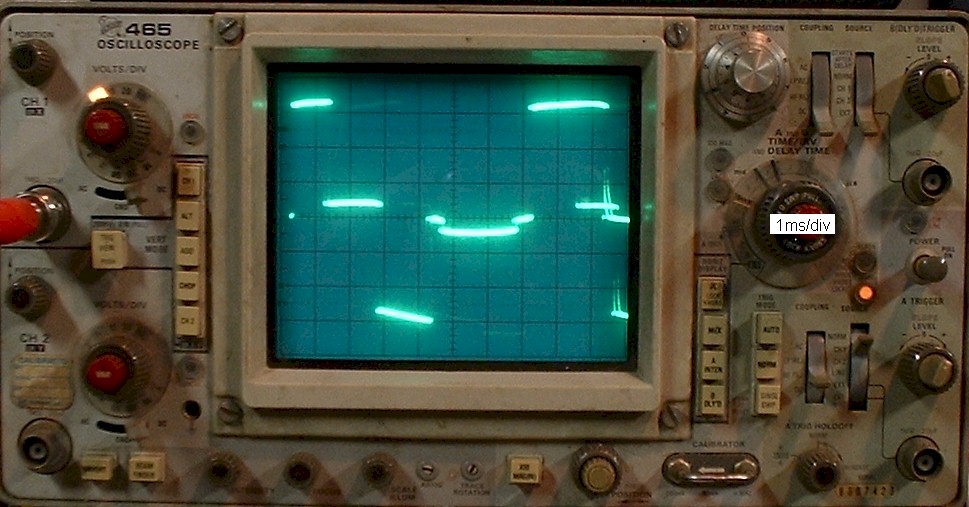
Battery voltage is at the limit. Shunting occurs, but not on every sweep of the trace. The right half of the screen shows a shunted trace overlayed with an un-shunted trace.
The present cycle, (the first upper pulse and the lower pulse), clearly show they were both shunted. In the previous cycle, as seen on the right side and slightly faded, it appears the positive pulse was not shunted.
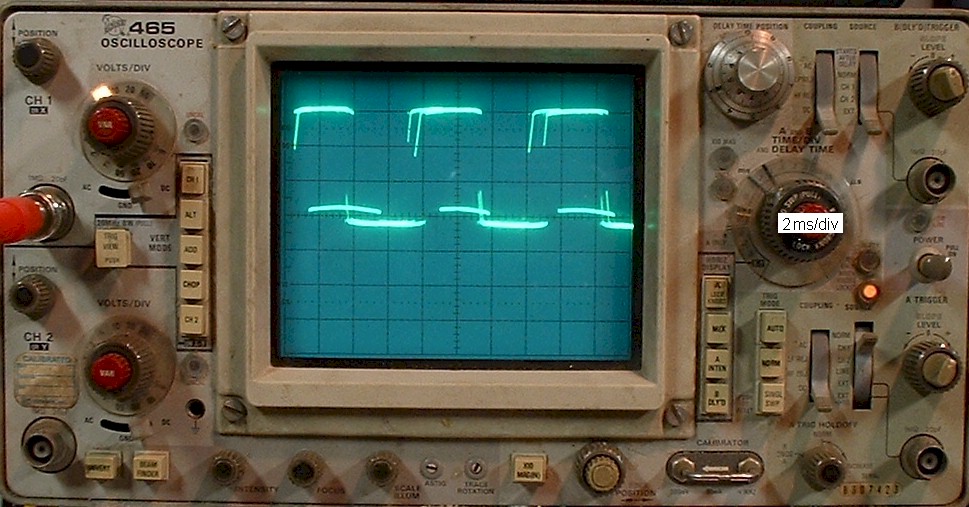
Fig. 3
Waveform between two alternator wires (2 yellow wires).
4000 RPM, Lights on.
Waveform measured AC voltage: 12.6 Vac
Battery Voltage: 14.30 Vdc
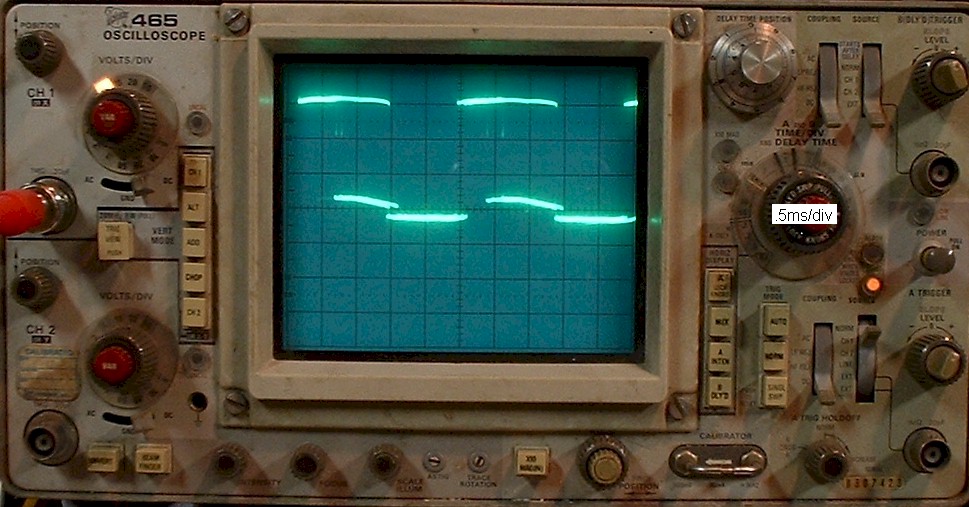
Fig. 4
Waveform between two alternator wires (2 yellow wires).
4000 RPM, Lights off.
Waveform measured AC voltage: 7.4 Vac
Battery Voltage: 14.23 Vdc
Fig. 5
Waveform between alternator wire and ground (yellow wire and ground).
1200 RPM, Lights on.
Waveform measured AC voltage: 8.5 Vac
Battery Voltage: 13.2 Vdc
Fig. 6
Waveform between alternator wire and ground (yellow wire and ground).
1200 RPM, Lights off.
Waveform measured AC voltage: 9.0 Vac
Battery Voltage: 14.58 Vdc
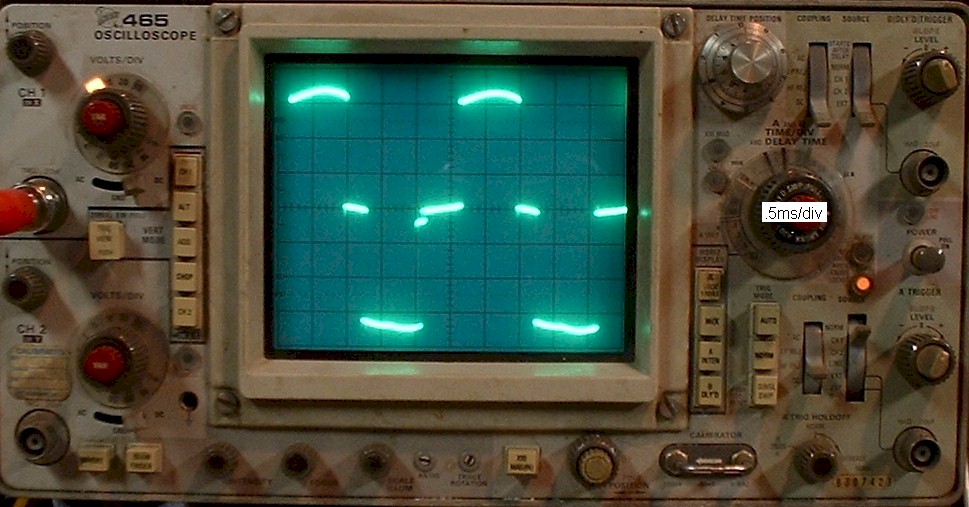
Fig. 7
Waveform between alternator wire and ground (yellow wire and ground).
4000 RPM, Lights on.
Waveform measured AC voltage: 8.7 Vac
Battery Voltage: 14.50 Vdc
In this figure, multiple oscilloscope traces are visible for a single phase. It can be seen that not every cycle gets shunted. Different cycles are shunted at different points in the cycle since the battery voltage is near the threshold. There is no way to isolate the individual traces because the traces are alternating every few cycles as the battery voltage wavers above and below the regulator's threshold-voltage. The oscilloscope can't capture one trace and hold it on the screen, so to make things clearer, one shunted cycle and one non-shunted cycle will be highlighted in figure 7A and 7B.
Fig. 7A
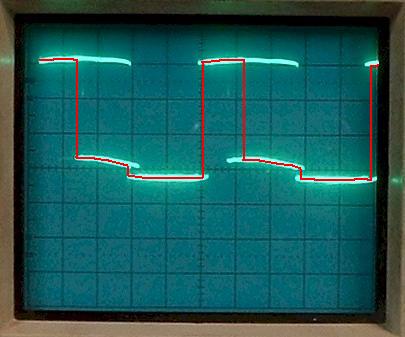
This is figure 7 with one path indicated in red.
Note that the cycles indicated here are shunted half way through positive cycle.
Fig. 7B
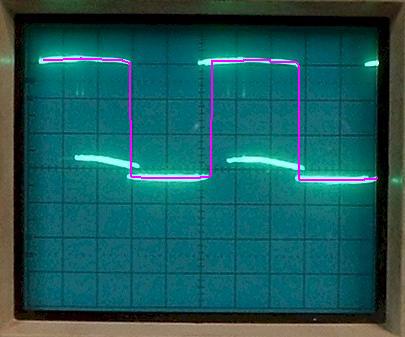
This is figure 7 with one path indicated in violet.
Note that the cycles indicated here are not shunted.
Fig. 8
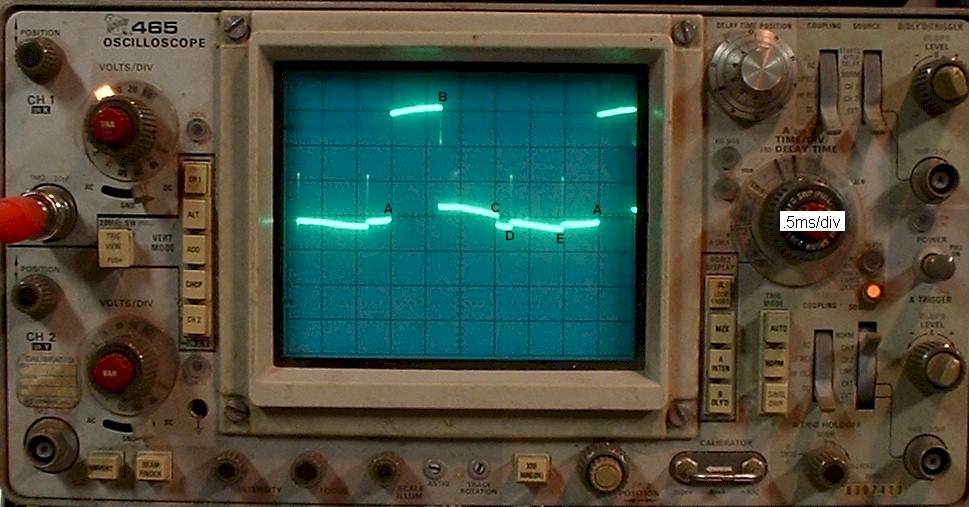
Waveform between alternator wire and ground (yellow wire to ground).
4000 RPM, Lights off.
Waveform measured AC voltage: 5.0 Vac
Battery Voltage: 14.35 Vdc
Here, every cycle gets shunted and the shunt events are clearly visible on the single phase. That is, the other phases being shunted leave little spikes on the phase being viewed by the oscilloscope. They are denoted by the transient spikes at B, D, and E.
If we set A as 0 degrees, the beginning of the cycle on the leg under test (leg 1), we see the shunt occurs at about 90 degrees (point B on the trace) for that leg. Assuming that there is way more power available to the charging system than is needed, we would expect each leg to shunt. And, if each leg has about the same power, the shunts should be evenly spaced. The shunt for leg 2 is at D which is 120 degrees after B, and leg 3 shunts at E which is a just a little early at about 100 degrees later. However, in the previous cycle, leg 3 appears to shunt at the expected location. Note how the other legs affect the waveform of the test leg slightly.
C is where leg 1 changes polarity (at 180 degrees).
Since the lights sre off, the alternator has a lot of excess power which is why every cycle gets shunted. One would expect the battery voltage to be higher, but this is not the case. The reason is because of the nature of the sensing circuit on the regulator. With every cycle being shunted, there is a lot of ripple in the battery voltage. The ripple has the effect of causing the regulator to shunt at a lower voltage.
It is important to realize that when hypothetical waveform A is made up of two unevenly spaced, but identical, waveforms B and C, waveform A may look symmetrical with pulses evenly spaced (Fig. 9), or asymmetrical with pulses unevenly spaced depending on the shape of B and C (Fig. 10).
In other words, If B and C are pure sinewaves, A will also appear as a pure sinewave (symmetrical with pulses evenly spaced) (Fig. 9).
As B and C change to non-sinusoidal shapes due to regulator shunting, A will no longer look symmetrical and it's pulses will become unevenly spaced (Fig. 10).
If B and C are evenly spaced (180 degrees out of phase) (Fig. 11), A will change it's shape as B and C change shape, but the pulses will remain evenly spaced (Fig.12). This is the main difference in looking at the waveforms of single-phase alternators versus 3-phase alternators.
Fig. 9
Fig. 10
Fig. 11
Fig. 12
This next figure is a sketch showing what the actual voltage trace might look like when the alternator is diconnected from the regulator and rectifier. There is no current flowing, so the open-circuit voltage can get pretty high. The voltage measurements are actual voltages taken from an earlier experiment.
Fig. 13
Note: there are 3 phases and each phase has 6 pole-pieces (which look like little coils) wired together on the stator. Therefore, the stator has 18 pole-pieces on it. The permanent-magnet rotor has 6 magnets on it. During rotation, all pole-pieces, of a particular phase, get the same magnetic pole applied to it at any given time. In other words, all of the pole-pieces associated with one phase, all work together. Since the magnetic poles alternate north and south, each phase alternates polarity 6 times per crank rev. Therefore, during each rotation of the crankshaft, each phase gets 6 north pulses and 6 south pulses. This means there are 36 pulses from the rectifier output for one crank rev.
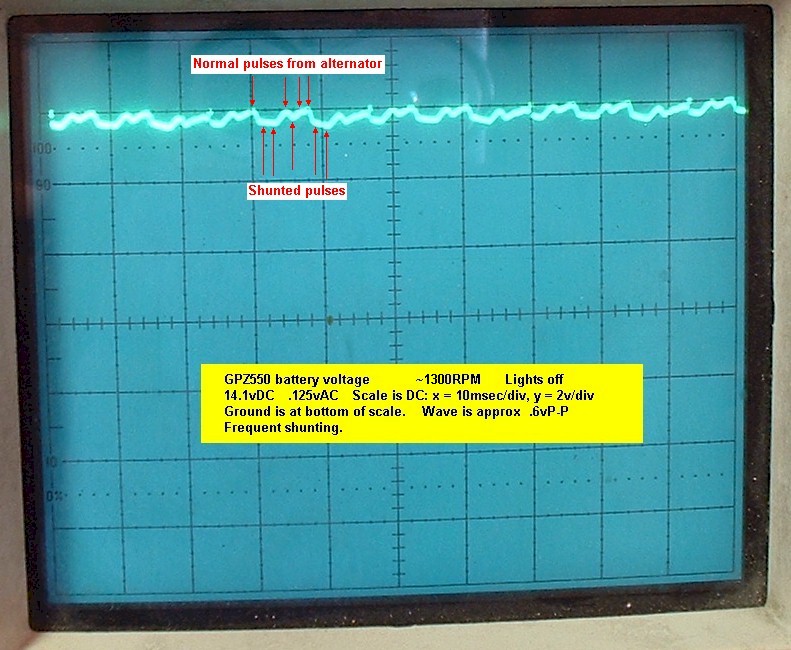
In figure 14, we see the voltage on the battery, just above idle, with the headlight off. Notice that since the light is off, the DC voltage is near the 14.5v maximum. Because of this, about half of the cycles are getting shunted. If all of the phases were exactly equal, each phase would be shunted at random, but most often there is one phase which tends to be slightly more powerful than the other two. That phase tends to get shunted the more (or causes the next phase to get shunted more) when the voltage is just starting to be limited by the regulator. This leads to a somewhat repeating pattern to the shunting sequence.
Note: other regulator designs may shunt all three phases simultaneously for one given cycle, then skip the shunting altogether on the next cycle. However, that leads to more fluctuation in the battery voltage under certain conditions.
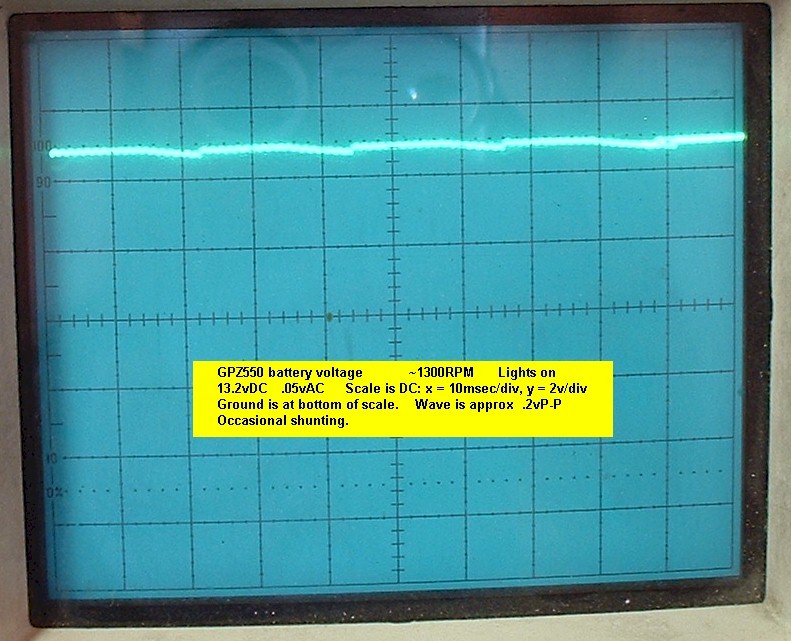
In figure 15, the headlight was turned on, which pulled the voltage down enough so that almost no shunting occurs on any of the phases. The result is a much smoother overall waveform. Because of the smoothness, other details become visible such as the dwell period for each ignition coil. The discontinuous points in the waveform indicate a firing of one of the ignition coils.
Fig. 15
In figure 16, we have a close up of the waveform which also shows the voltage sag due to the current building in the two ignition coils. The ignition coils fire once for each crank revolution giving a total of two fires per revolution.
(Note: due to the persistence of the oscilloscope phosphor, the photo actually shows several traces overlapped here. Only one of the traces had a shunt event.)
Fig. 16
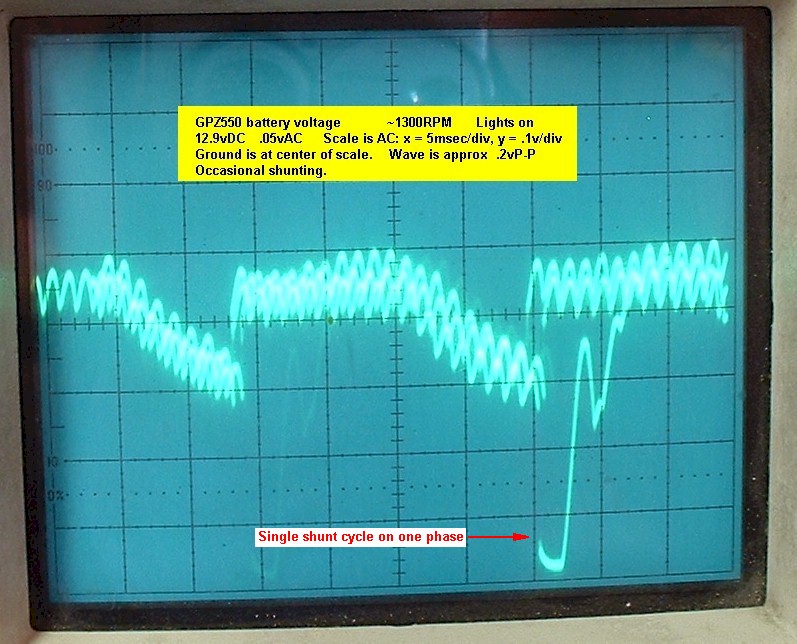
Figure 17 is a cleaned-up drawing of figure 16 to better illustrate what the voltage looks like. The point at which the ignition coils fire is indicated. The portion where the voltage starts to go down right before the coil fires is the coil's dwell period. A rough estimate shows that at 1300 RPM, the dwell period is roughly 8 alternator pulses. That's 8 out of 36 pulses, or we can easily convert that to degrees as 80 degrees out of 360 degrees.
Fig. 17
Figure 18 shows the voltage at 2000 RPM. Naturally, there is much more shunting there. The lower area of the waveform, identified by the squiggles below the main trace, show the shunted pulses.
Fig. 18
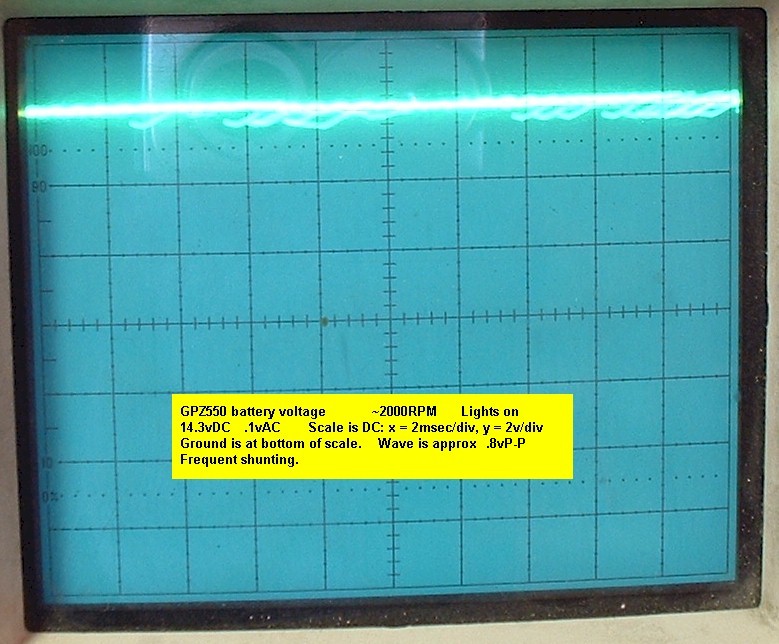
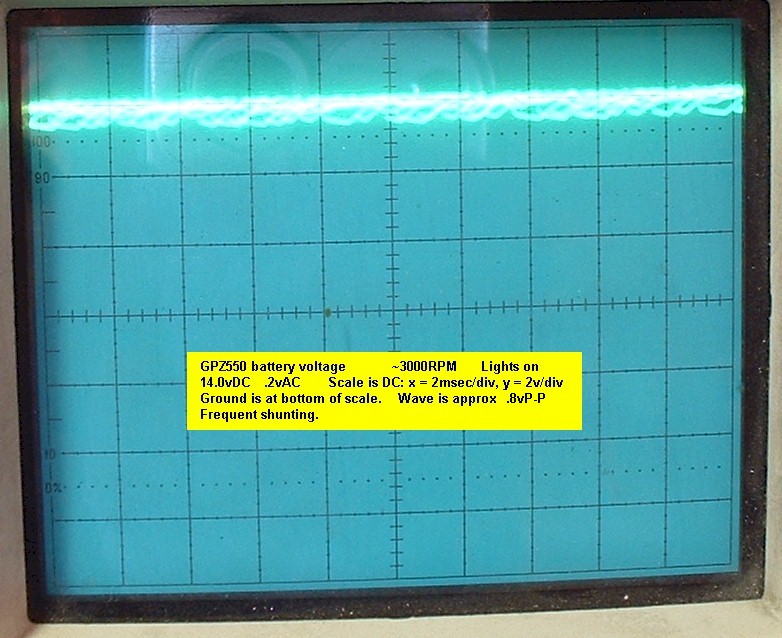
Figure 19 shows the voltage at 3000 RPM, and there is even more shunting there.
Fig. 19